3D Mapping Database Aided GNSS RTK and Its Assessments in Urban Canyons

H.F., N., Hsu, L.T.

IEEE Transactions on Aerospace and Electronic Systems (2021)

journal Q1 精选页面
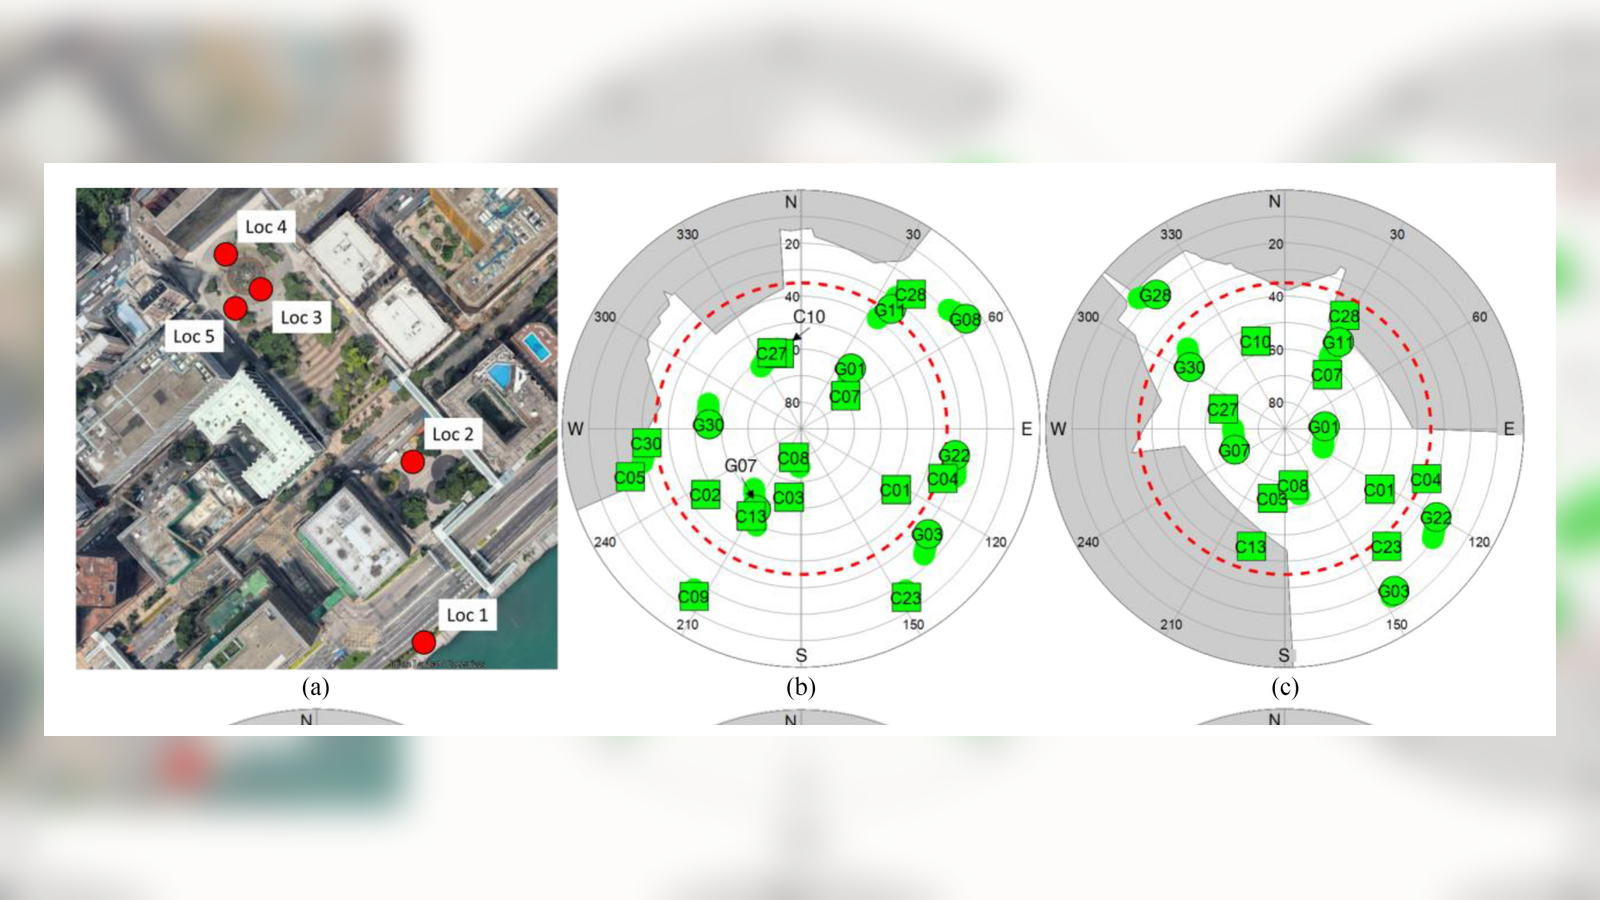
用于评估 3D mapping database-aided GNSS RTK 的城市场景测试点与 sky masks。
图 3 视觉细节:香港测试点与 sky masks,用于评估 3D mapping database-aided GNSS RTK。

图像

在流程定义 3D 地图辅助 RTK 后,这张热力图展示在模糊度解算前如何给候选位置评分。
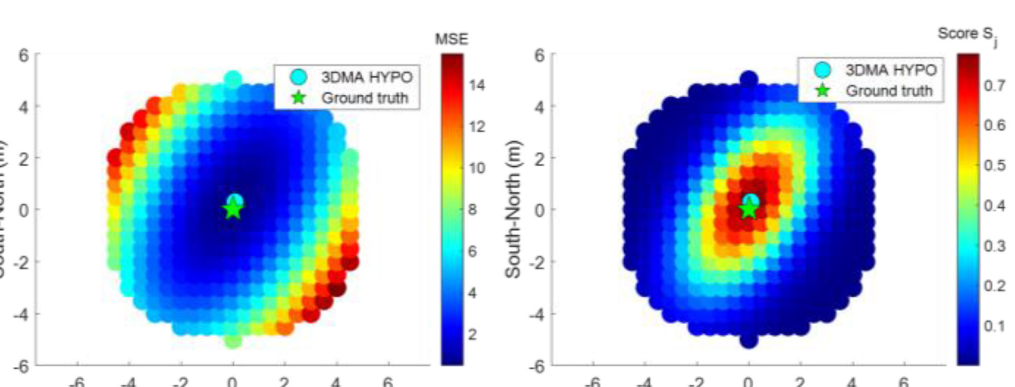
Heatmaps of position hypothesis mean square error and candidate score.
图 2:利用载波相位一致性对位置假设进行评分。

论文随后在香港多个具有不同天际遮挡模式的地点测试该方法,因此天空遮罩成为评估的核心。
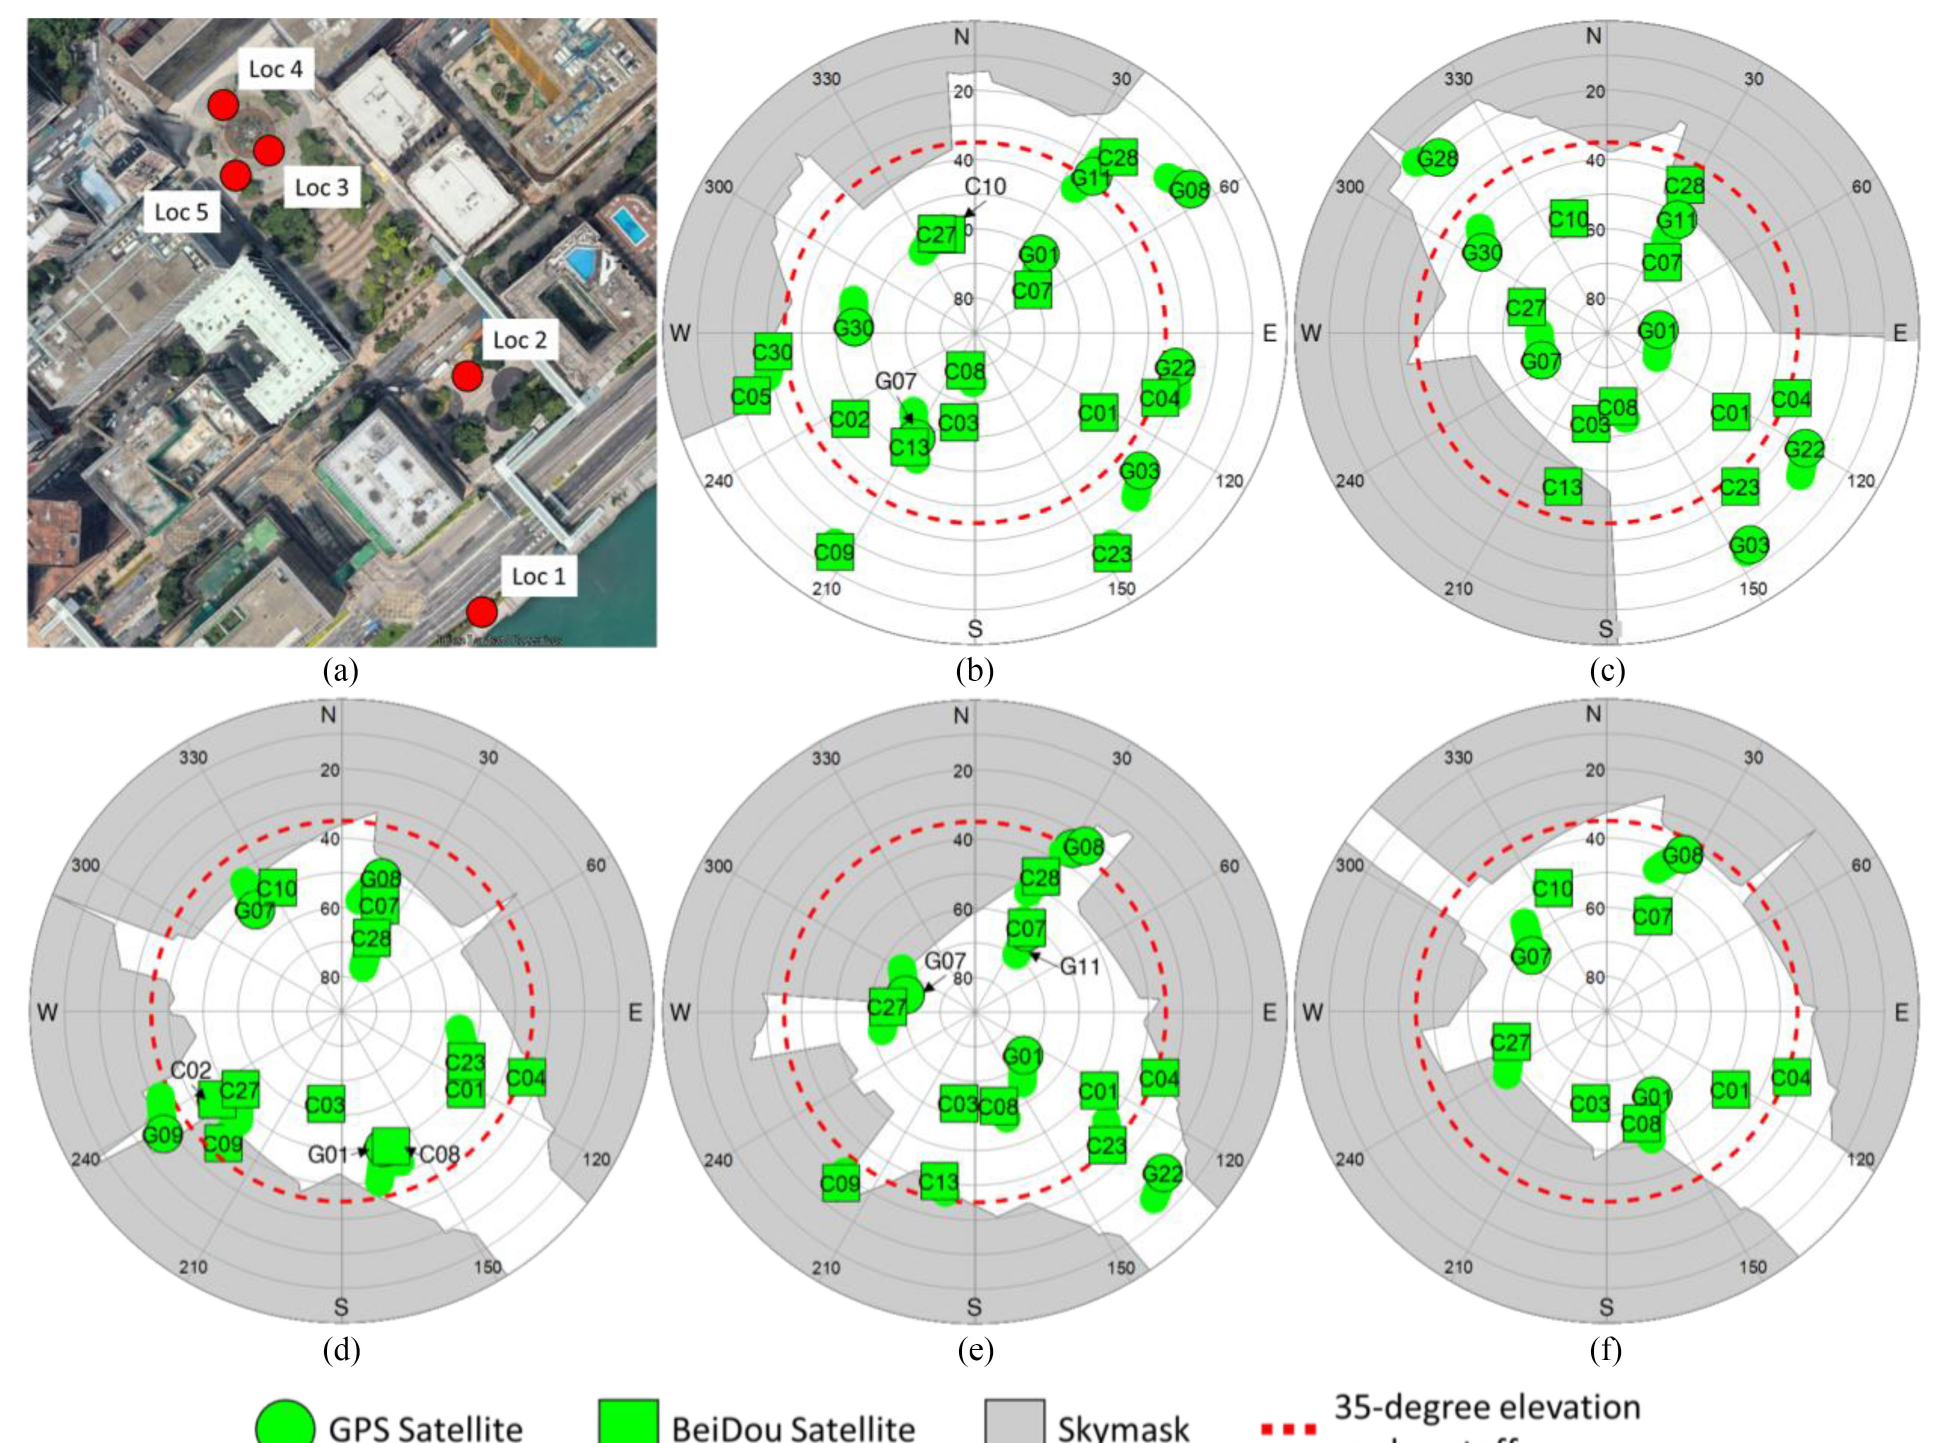
Hong Kong experiment locations and skymasks at five urban test locations.
图 3:用于城市峡谷评估的实验地点和天空遮罩。

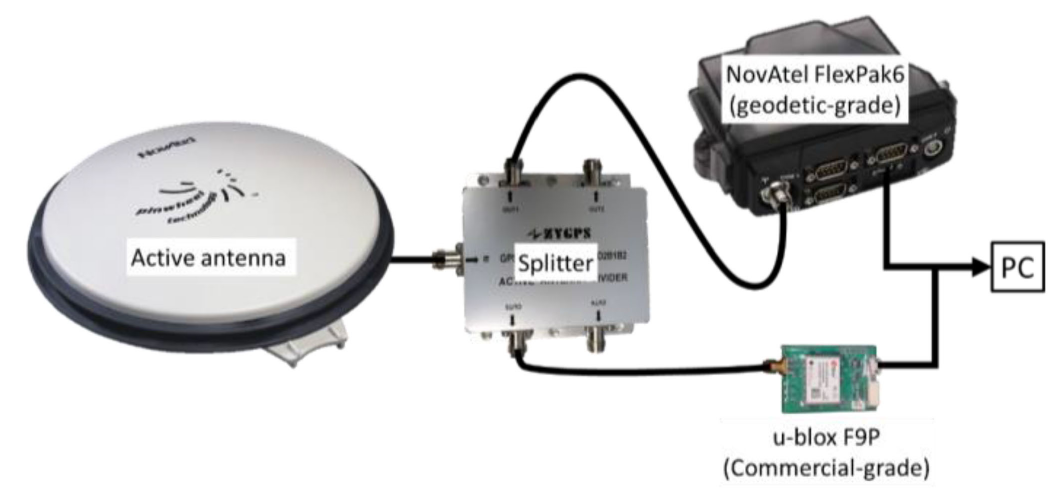
共用天线和接收机设置让研究能在相同卫星环境下比较测地级与商用接收机。

Experiment equipment with antenna, splitter, geodetic receiver, commercial receiver, and PC.
图 4:用于真值确定和 RTK 评估的实验设备。

在实验设置固定后,论文把定位误差与模糊度精度因子、几何精度因子和可用卫星数随时间的变化联系起来。
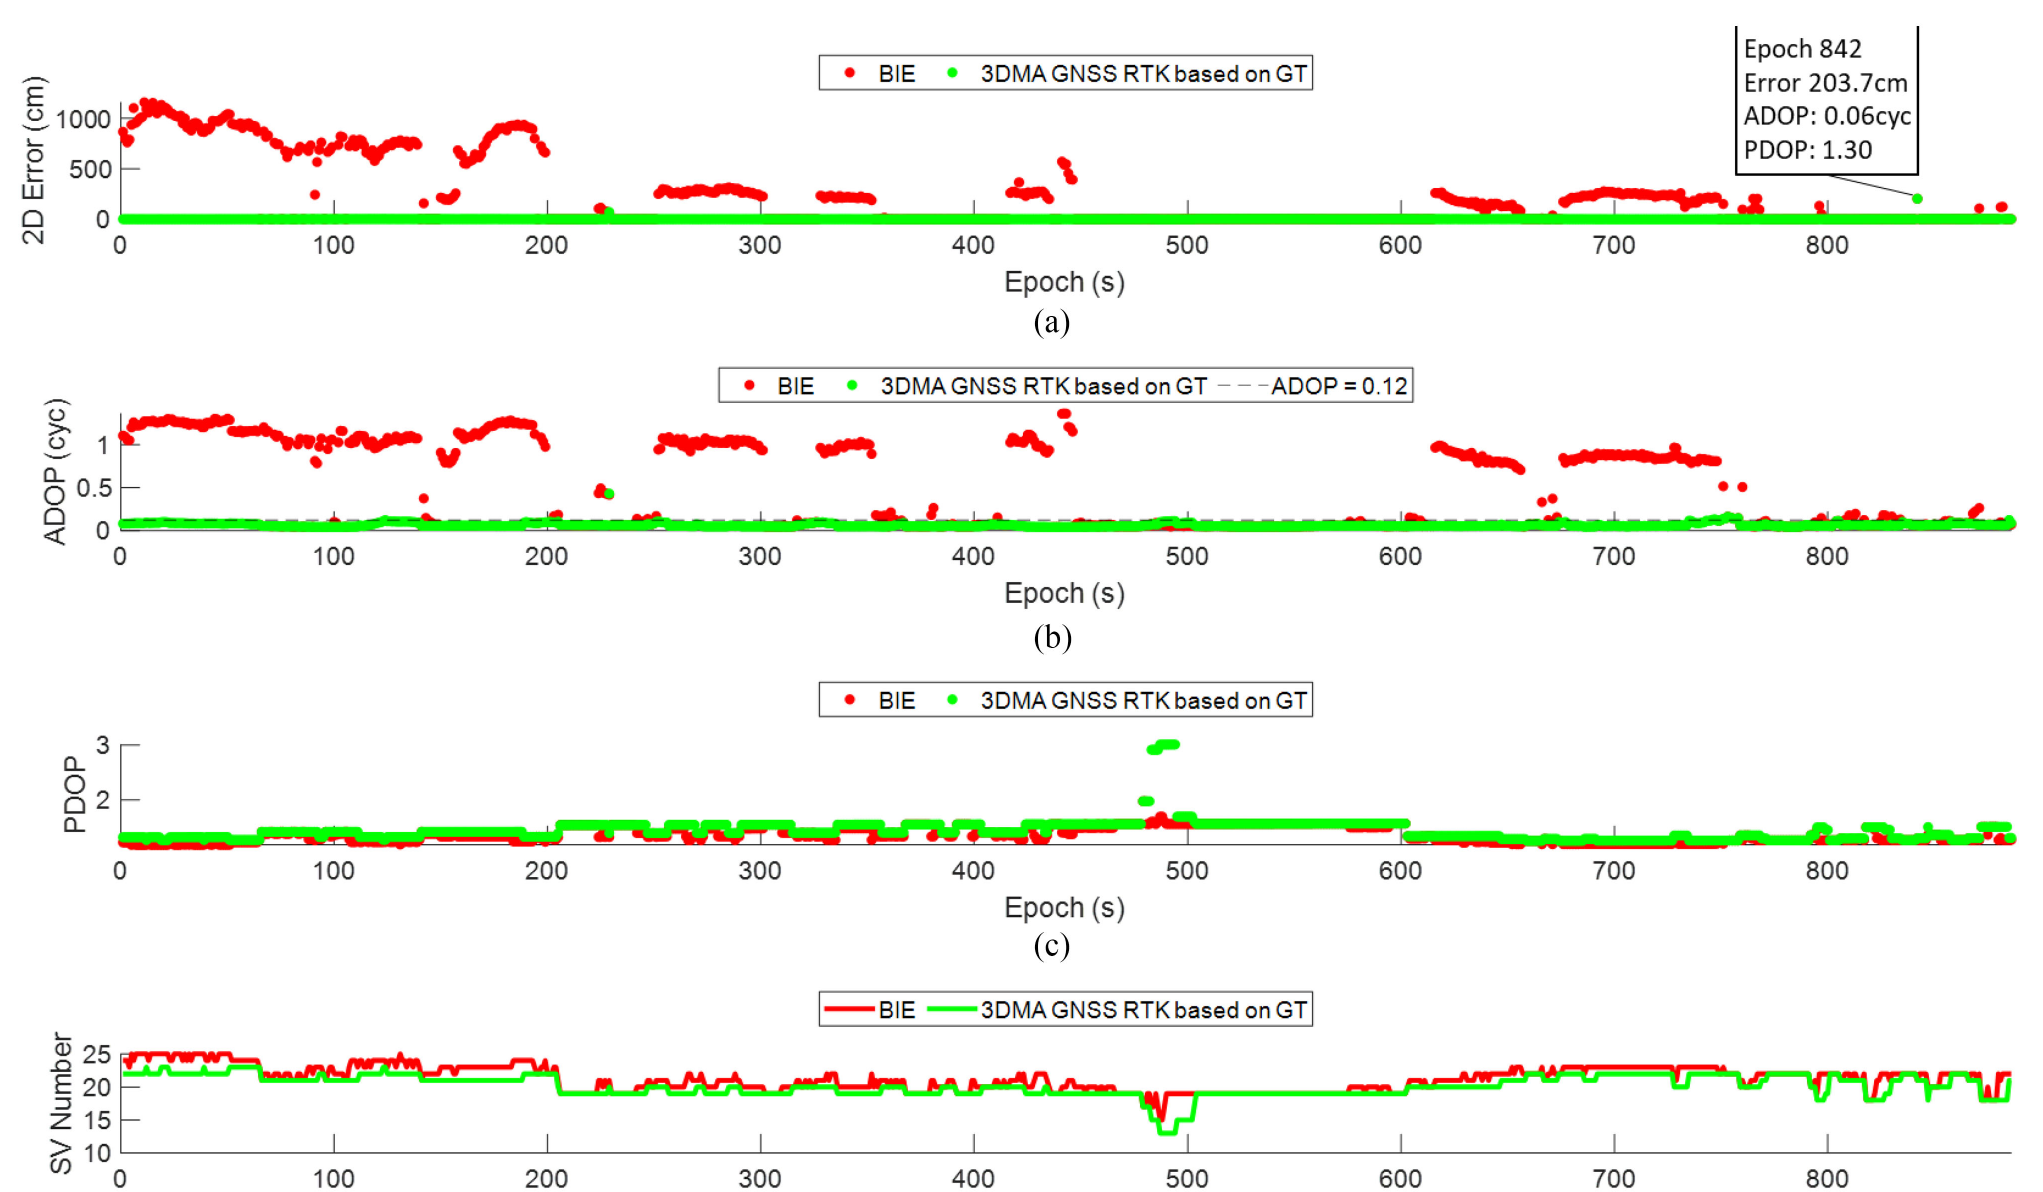
Positioning error, ADOP, PDOP, and satellite number time series for 3DMA GNSS RTK.
图 5:定位误差、模糊度精度因子、几何精度因子和卫星数的时间序列比较。

时间序列表现进一步用统计方式总结,说明 3DMA 辅助 RTK 在多大比例上改善了 2D 误差分布。

CDF of 2D positioning error and box plots for 3DMA BIE RTK experiments.
图 6 和图 7:2D 定位误差的分布和箱线图总结。

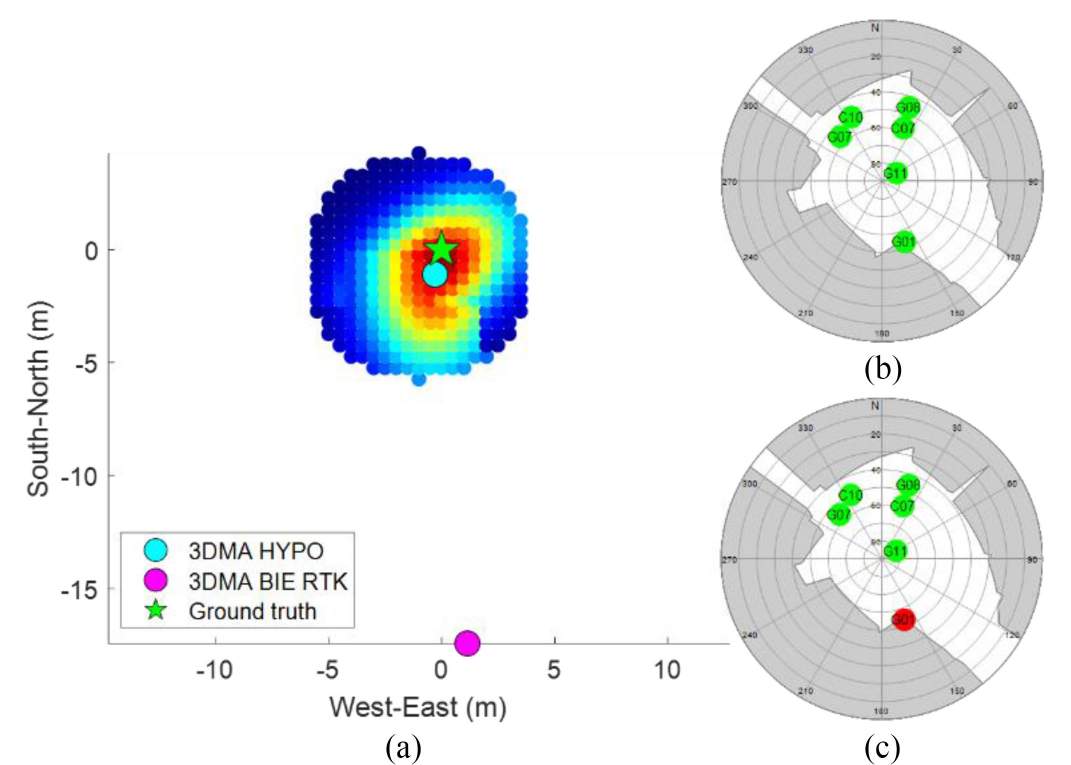
这个诊断案例通过比较位置热力图和候选位置的可见性判断来解释评分行为。

Position heatmap and skymasks showing satellite selection at ground truth and 3DMA hypothesis.
图 8:用于解释噪声观测案例的位置热力图和天空遮罩比较。

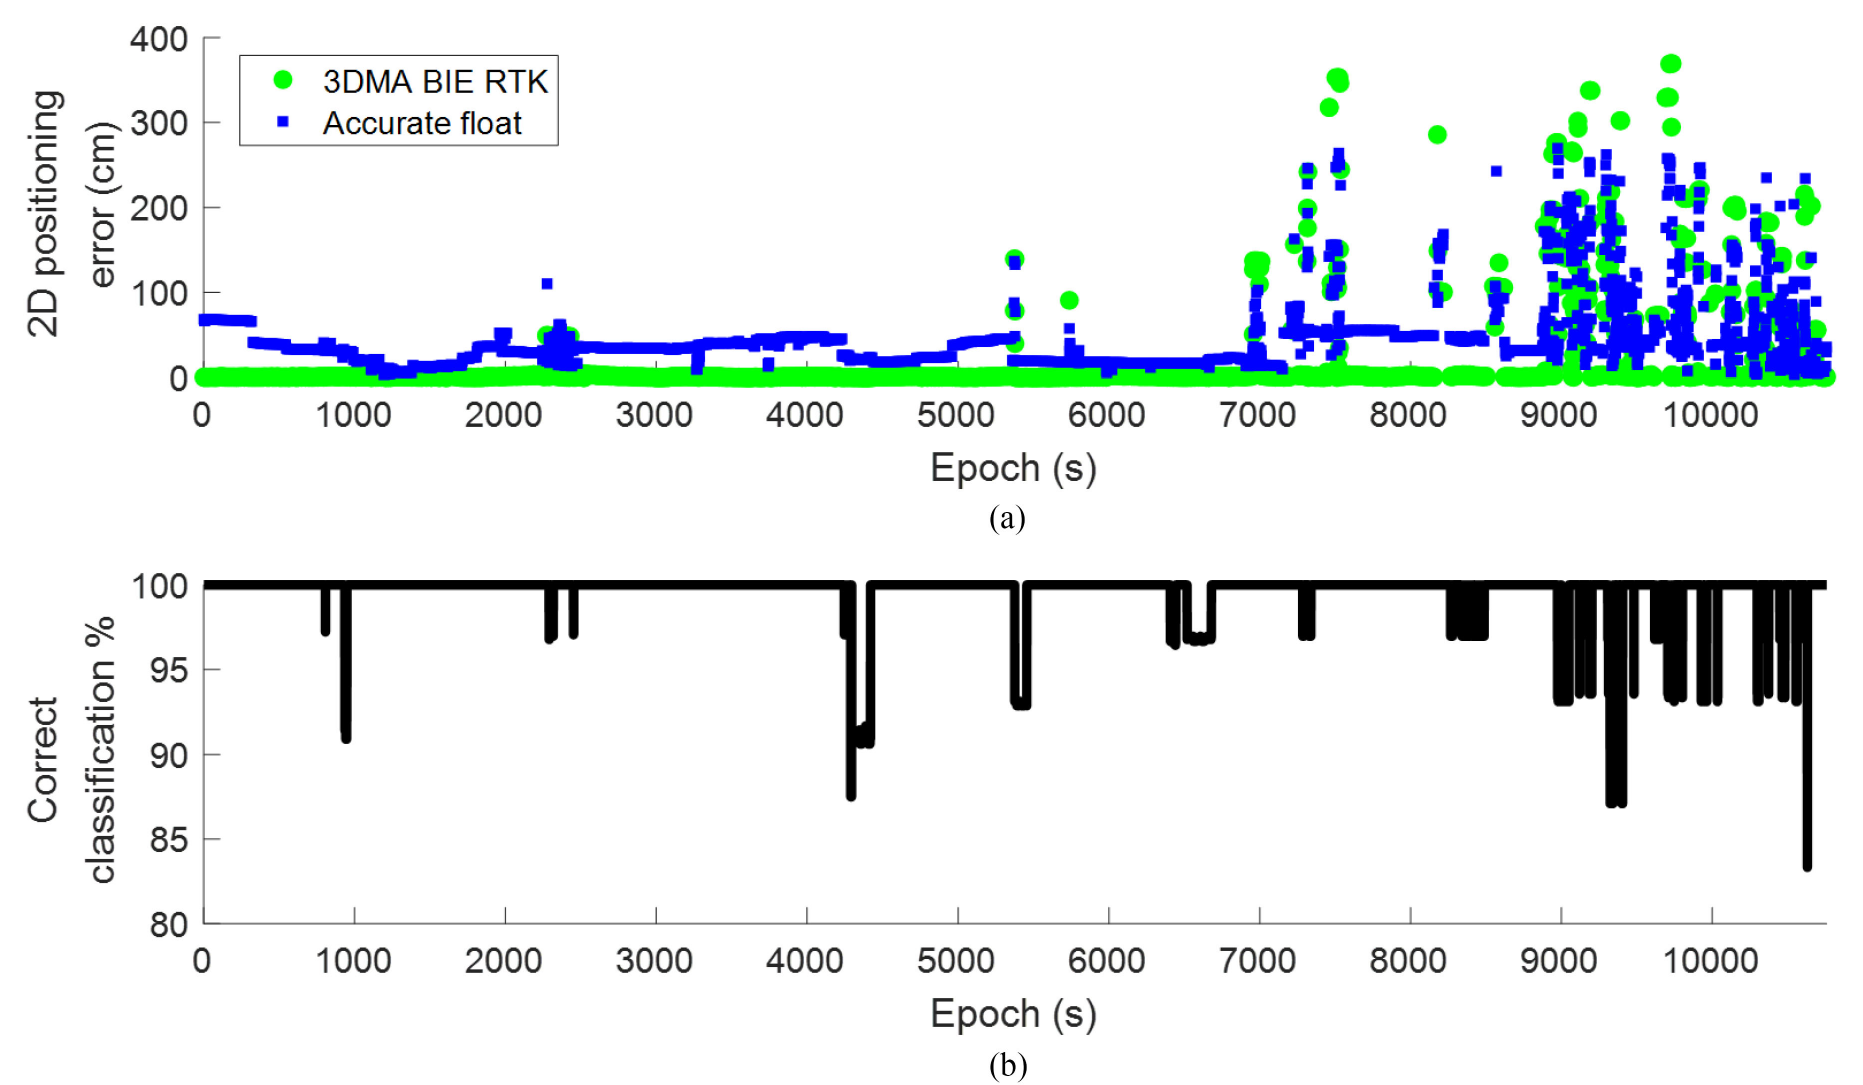
长时间实验检查同一套基于可见性的逻辑在数小时城市数据中是否保持稳定。

2D positioning error and visibility classification correctness over a three-hour experiment.
图 10:三小时定位误差和可见性分类正确率。