Grid-based 3DMA GNSS with clustering and Doppler velocity using factor graph optimisation

Ng, H. F., Zhong, Q., Groves, P., Hsu, L. T.

The Journal of Navigation (2025)

journal Q1 Featured page
Clustering and trajectory panels from the vehicular 3DMA GNSS experiment.
Figure 7 visual detail: clustering and trajectory panels from the vehicular 3DMA GNSS experiment.

Summary

Grid-based 3DMA GNSS combines candidate clustering, Doppler-derived velocity, and factor graph optimization to improve urban GNSS positioning in deep urban scenes.

Highlights

  • Region-growing clustering separates multimodal 3DMA GNSS candidate locations before factor graph optimization.
  • The paper evaluates static London data and a vehicular Canary Wharf experiment, comparing loosely coupled and hybrid-coupled FGO variants.

Figures

After candidate scores are computed, the paper uses region growing to split likely receiver locations into separate clusters instead of forcing a single candidate cloud.
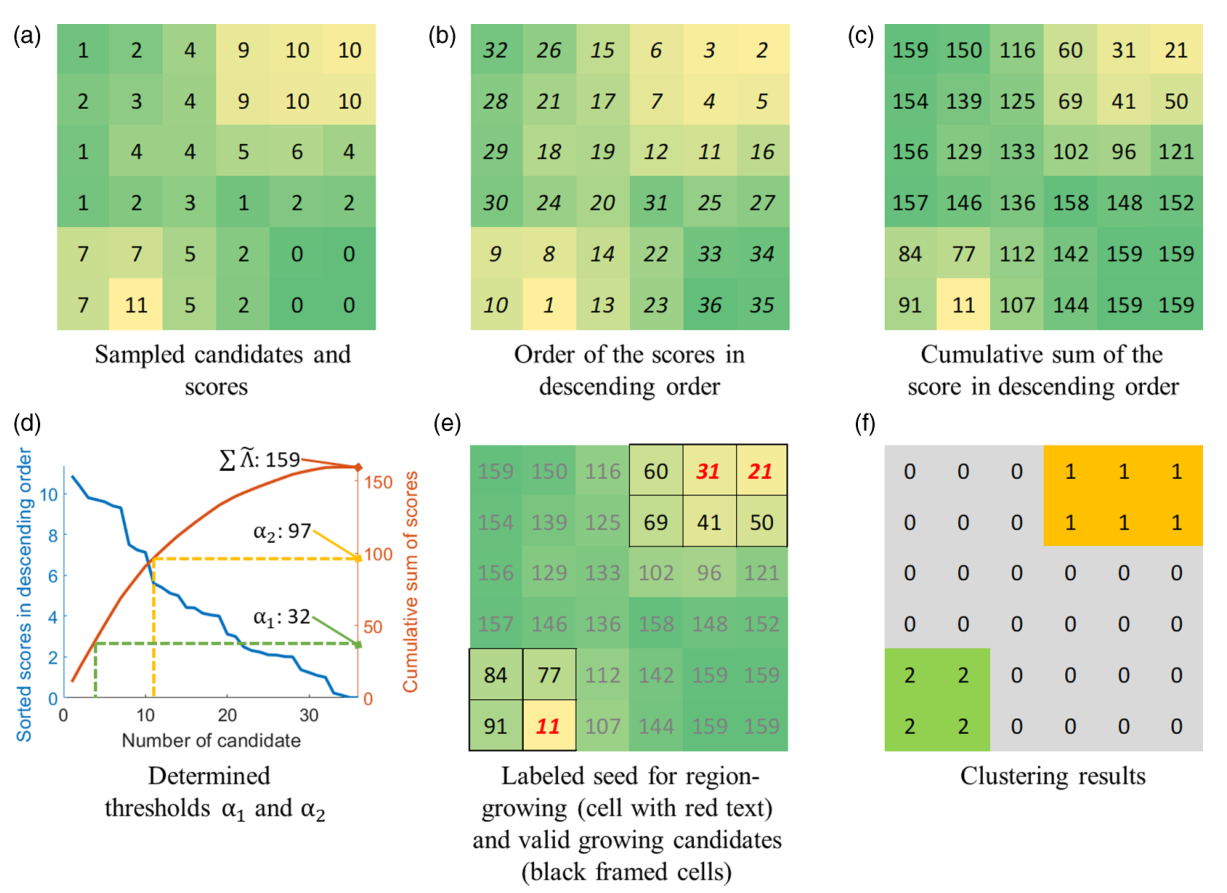
Simplified region-growing example with sampled candidates, score ordering, thresholds, and clustering results.
Figure 2: simplified example of the region-growing algorithm used for clustering sampled 3DMA GNSS candidates.

The selected cluster then becomes one of the measurement factors in a hybrid-coupled graph that also uses pseudorange and Doppler information.
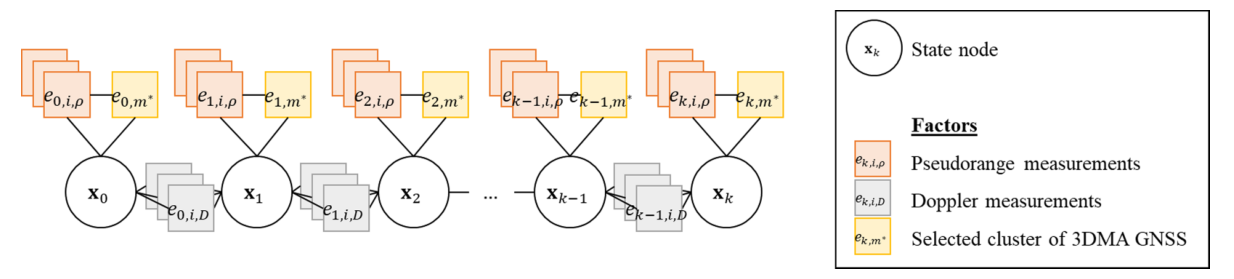
Hybrid-coupled factor graph structure with state nodes, pseudorange factors, Doppler factors, and selected 3DMA GNSS cluster factors.
Figure 4: factor graph structure for the proposed hybrid-coupled 3DMA GNSS approach.

Before reporting accuracy, the paper documents the urban obstruction level and satellite visibility conditions used in the experiments.
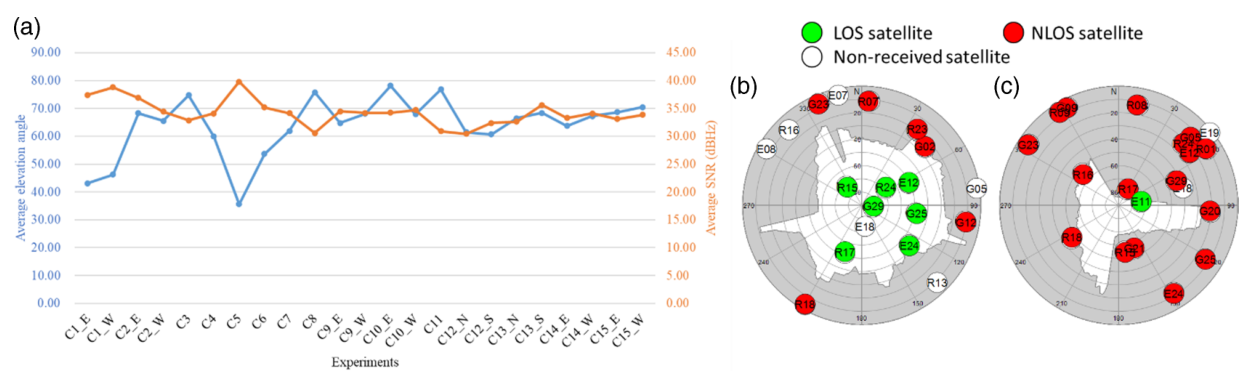
Experiment statistics and sky masks showing building-boundary elevation angle, SNR, LOS satellites, and NLOS satellites.
Figure 5: average building-boundary elevation, received SNR, and sky masks for representative test locations.

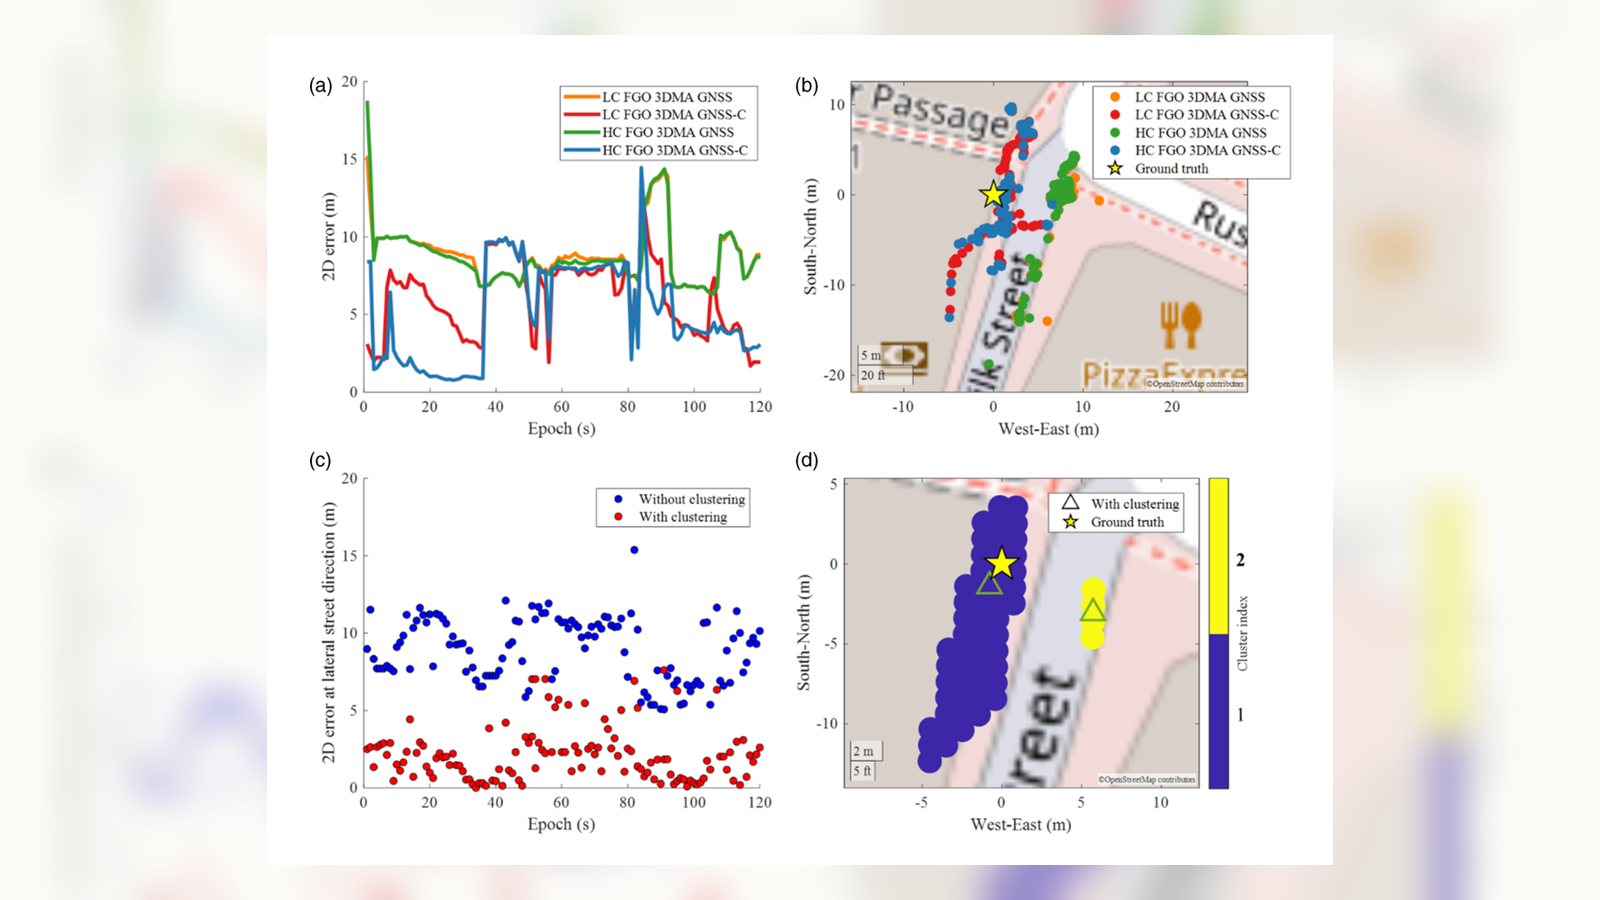
The static result shows how clustering reduces lateral street-direction error and separates competing candidate clusters near the true position.
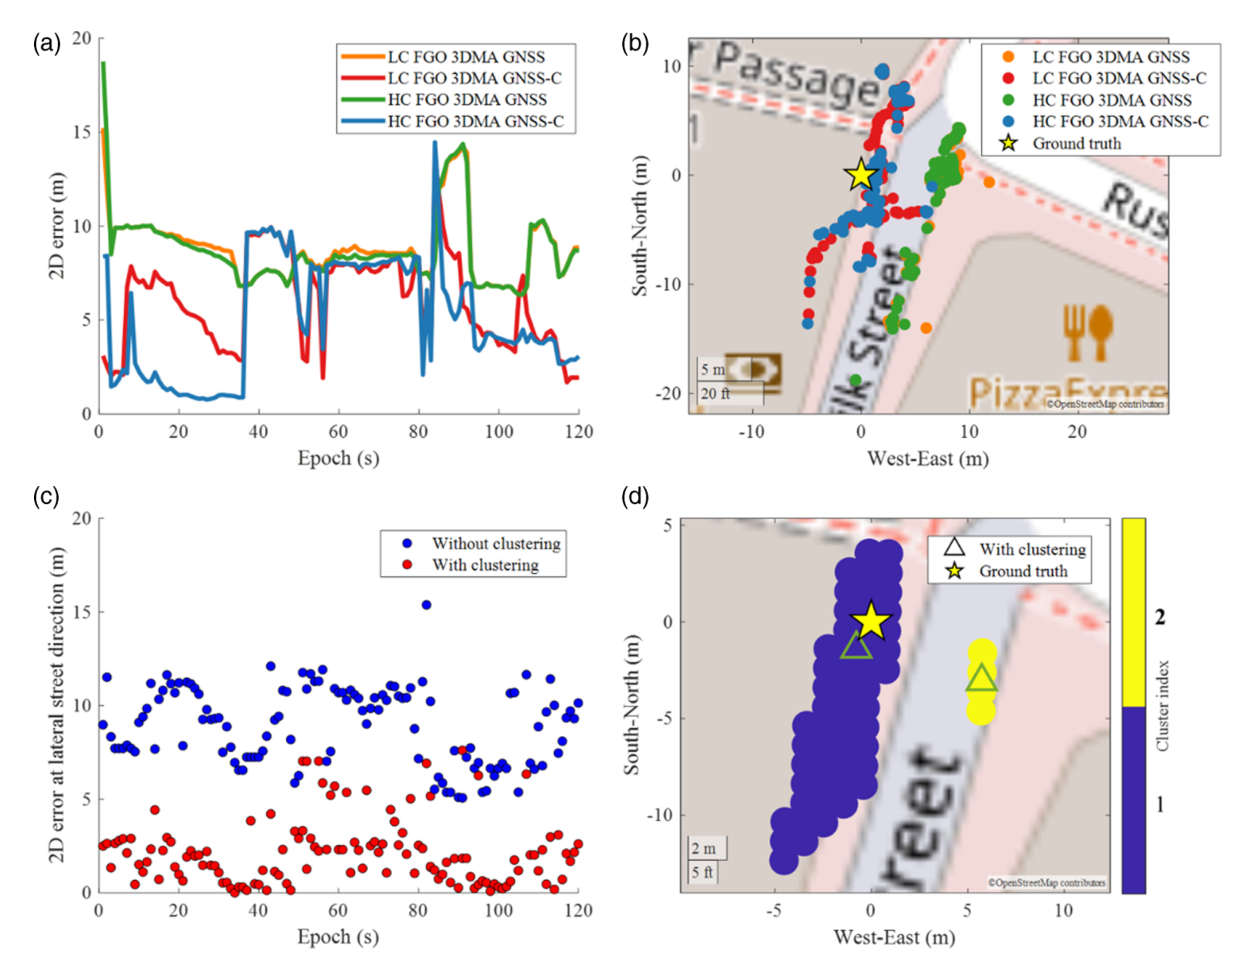
Static positioning result plots comparing clustered and non-clustered 3DMA GNSS FGO methods at a difficult street location.
Figure 7: horizontal errors, map plots, and multiple-cluster example for a static urban test location.

The vehicular summary extends the static findings to a dynamic route, comparing error percentiles across conventional, grid-filter, and FGO-based methods.
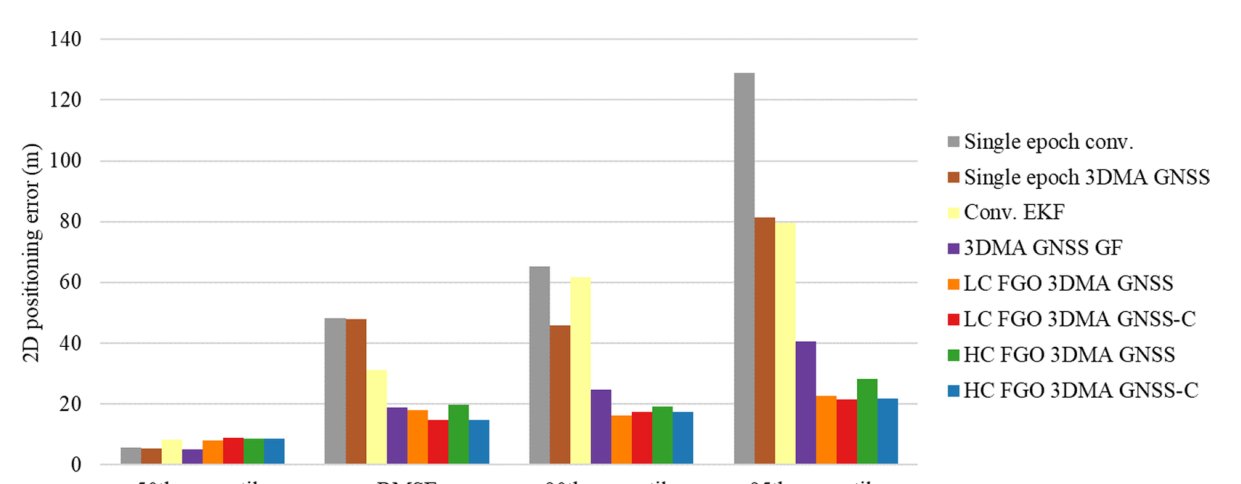
Bar chart of vehicular experiment RMSE and 50th, 90th, and 95th percentile positioning errors across algorithms.
Figure 9: RMSE and percentile horizontal radial positioning errors for the vehicular experiment.