
Integrity-Constrained Factor Graph Optimization for GNSS Positioning in Urban Canyons
NAVIGATION: Journal of the Institute of Navigation (2024)
Summary
Integrity-constrained FGO reweights faulty GNSS measurements with switchable pseudorange and chi-square-test factors while preserving geometry for protection-level calculation.
Highlights
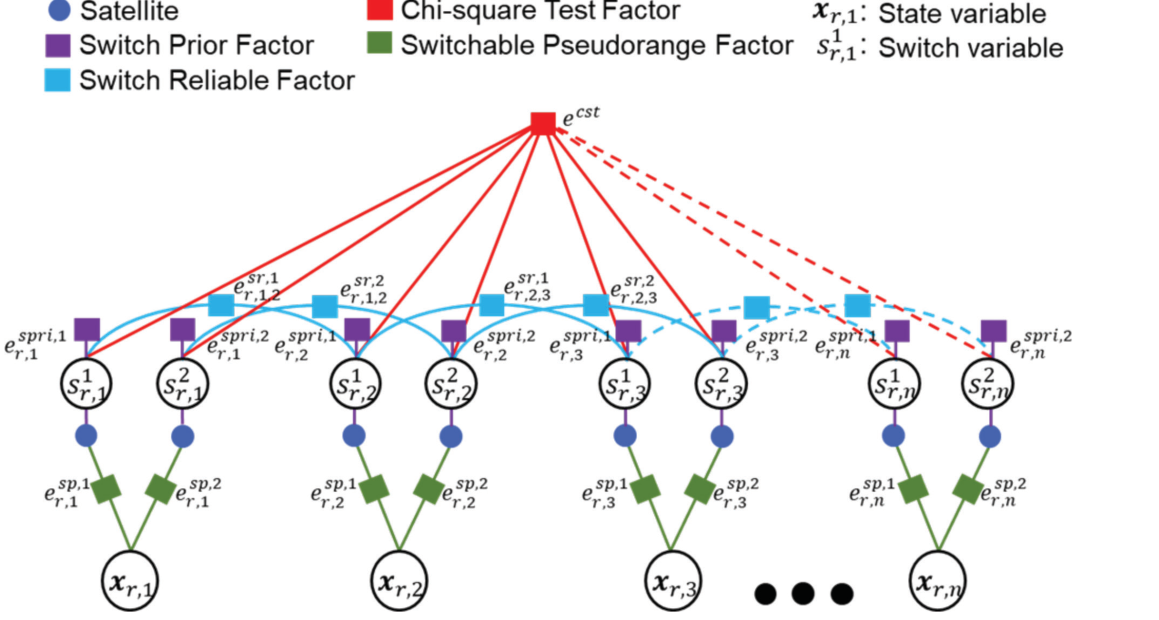
- The factor graph combines switchable pseudorange, switch prior, switch reliable, and chi-square test factors.
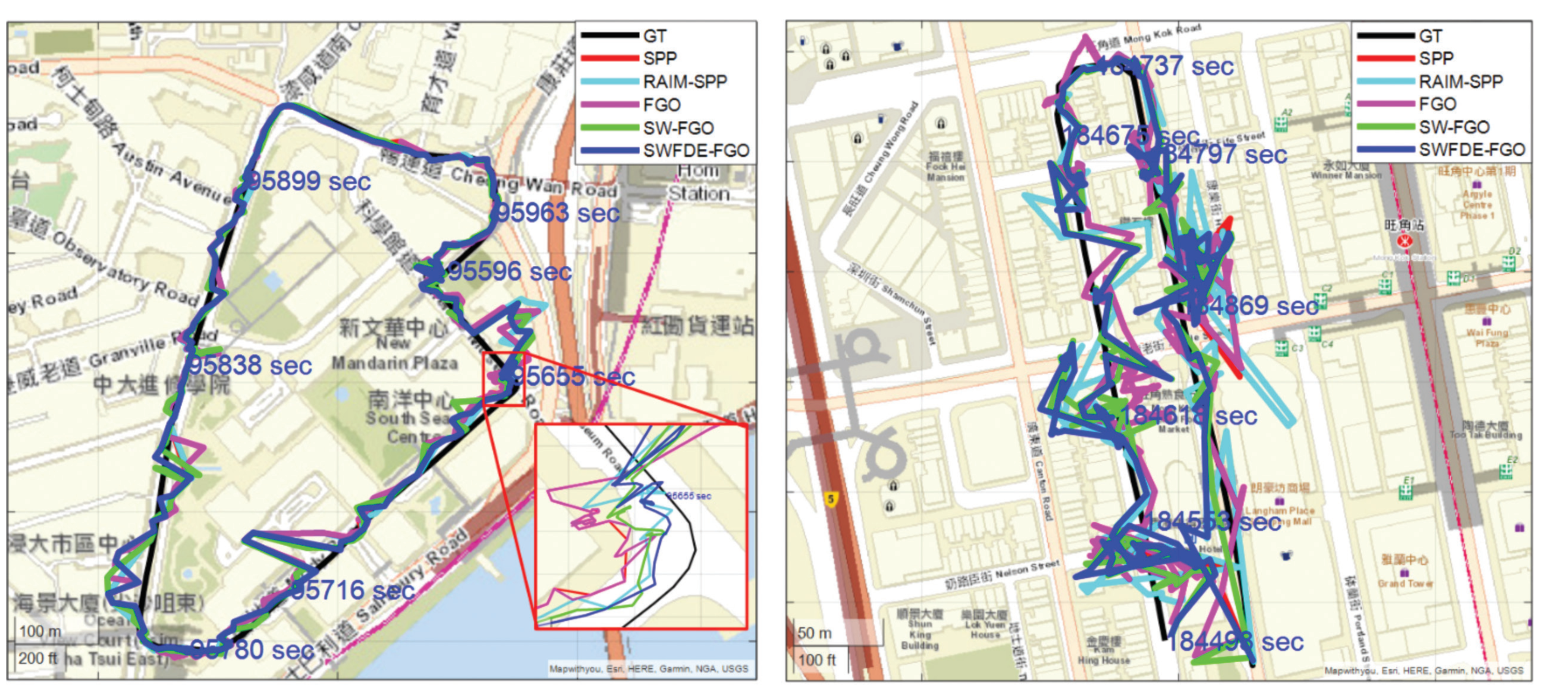
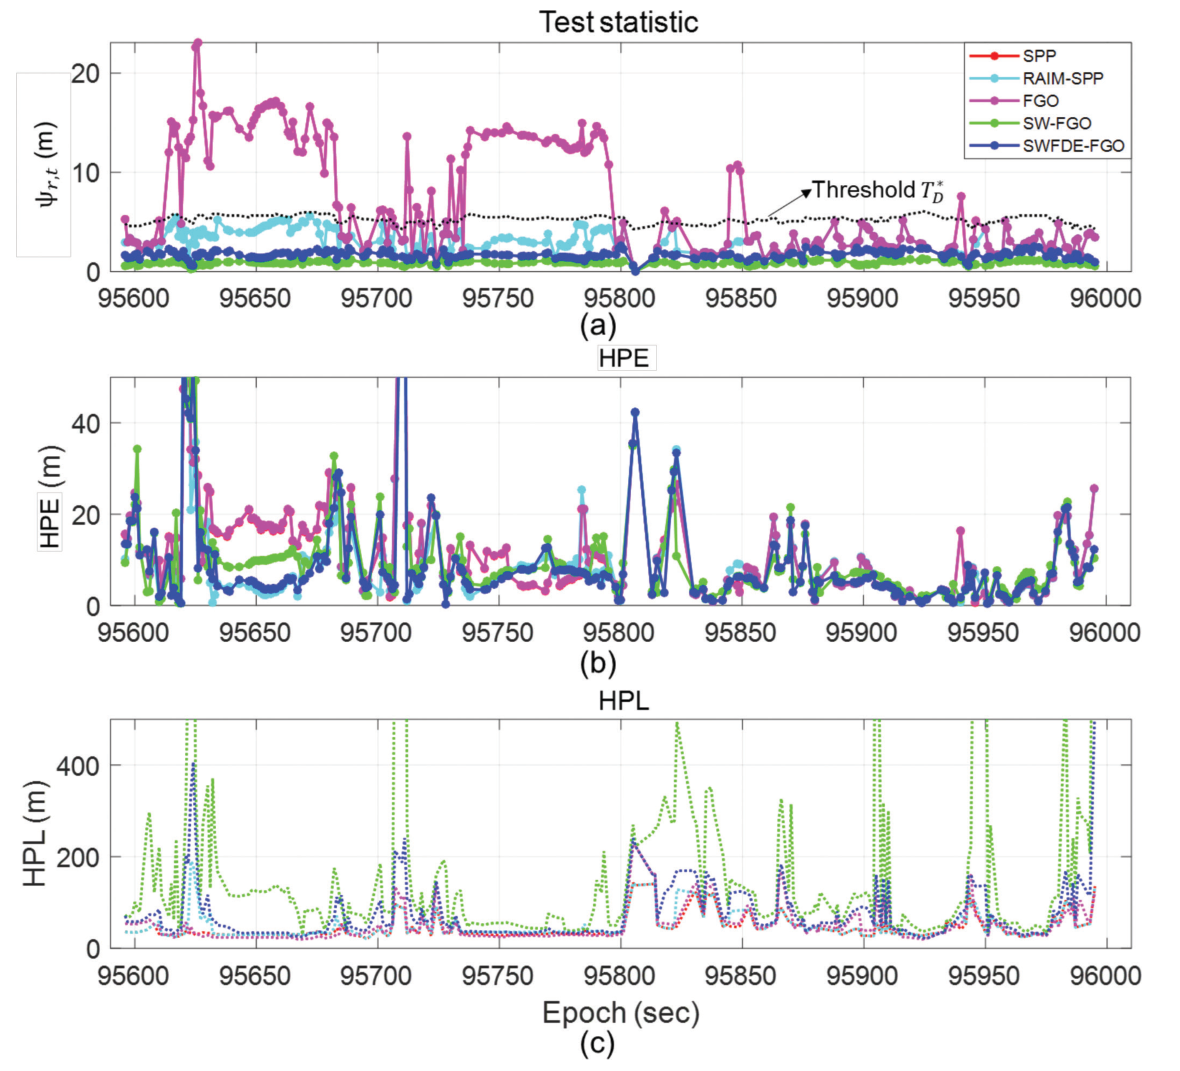
- UrbanNav experiments connect the method to real medium and harsh urban scenarios, including HPE, HPL, skyplot, and trajectory results.
Figures
The flowchart becomes a factor graph in which switch variables are estimated across epochs instead of removing satellites outright.
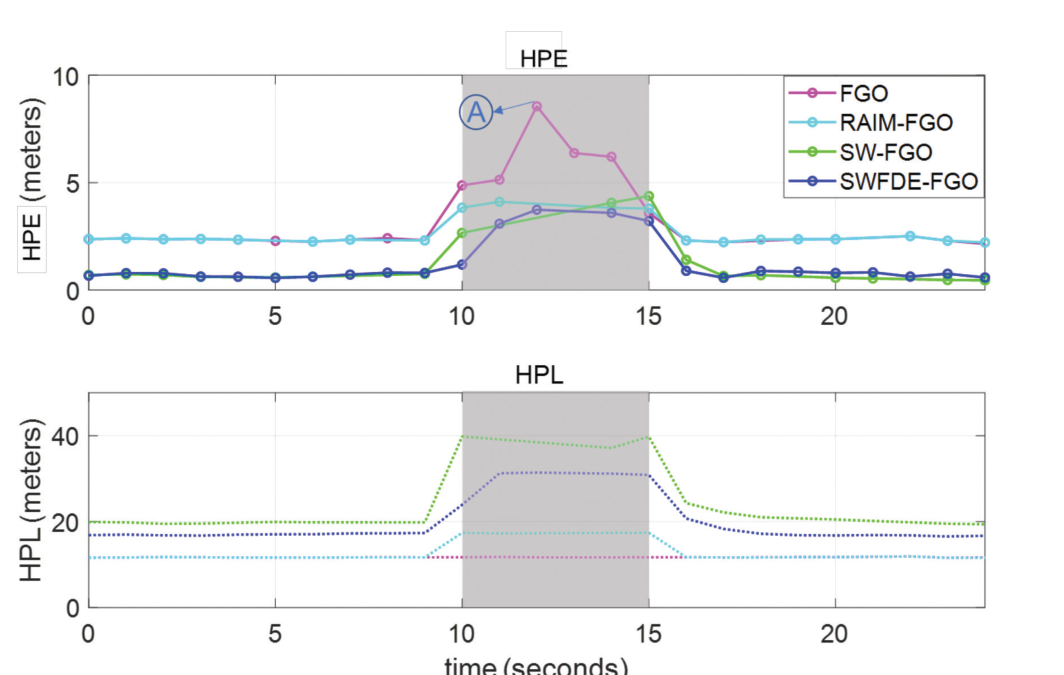
The controlled bias test shows how the chi-square-test factor affects horizontal position error and protection level during the fault period.
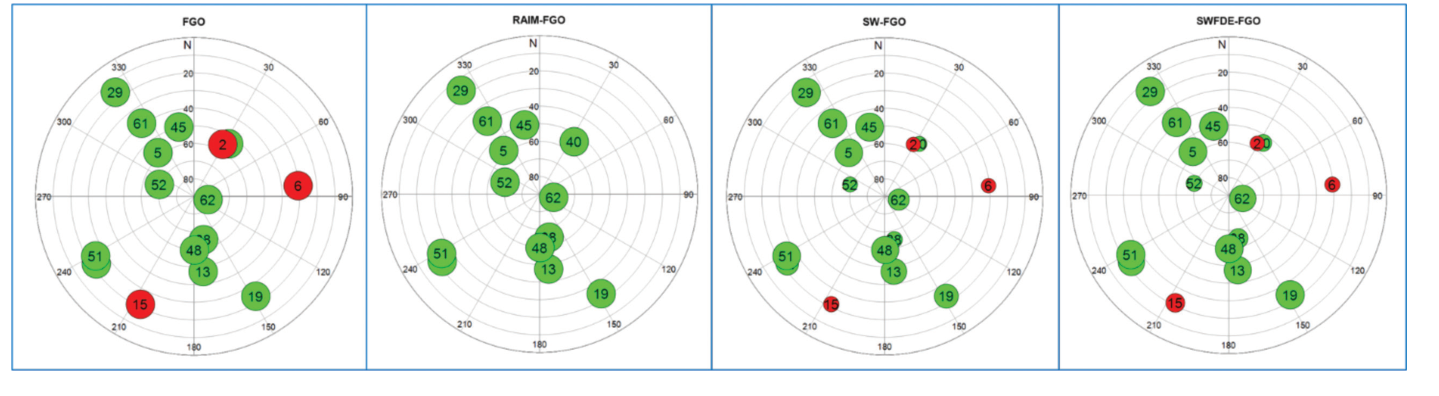
The skyplot explains the key design choice: faulty satellites are downweighted by switch values, helping preserve useful geometry.
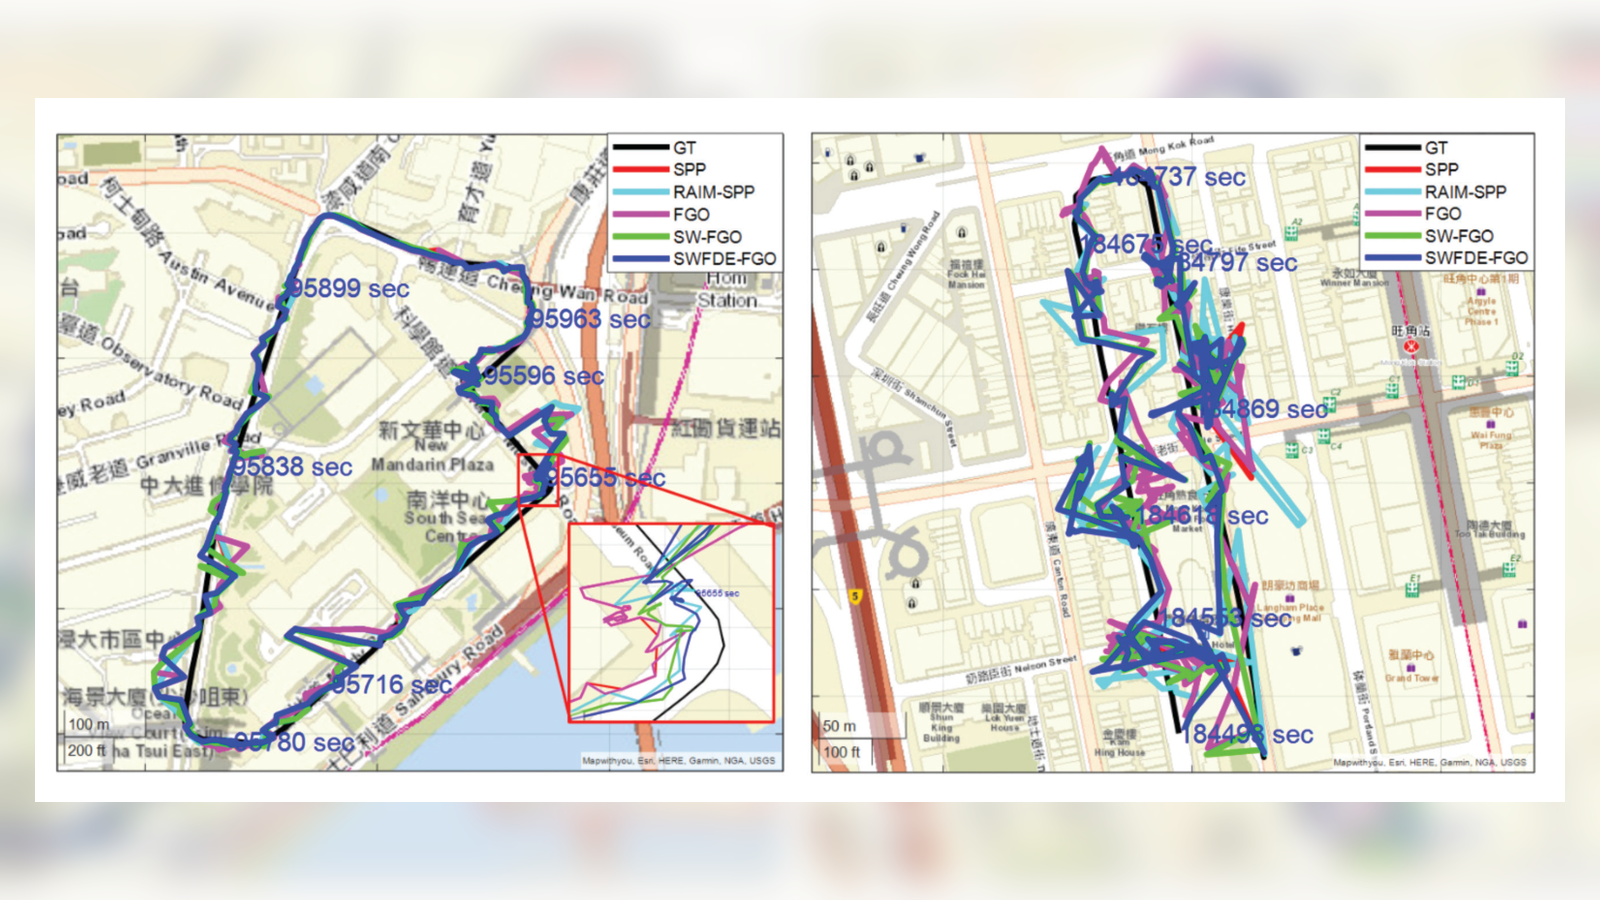
The real UrbanNav trajectories move the evaluation from controlled bias injection to medium and harsh urban routes.
The UrbanNav result curves connect trajectory behavior to the integrity metrics used to compare the methods.
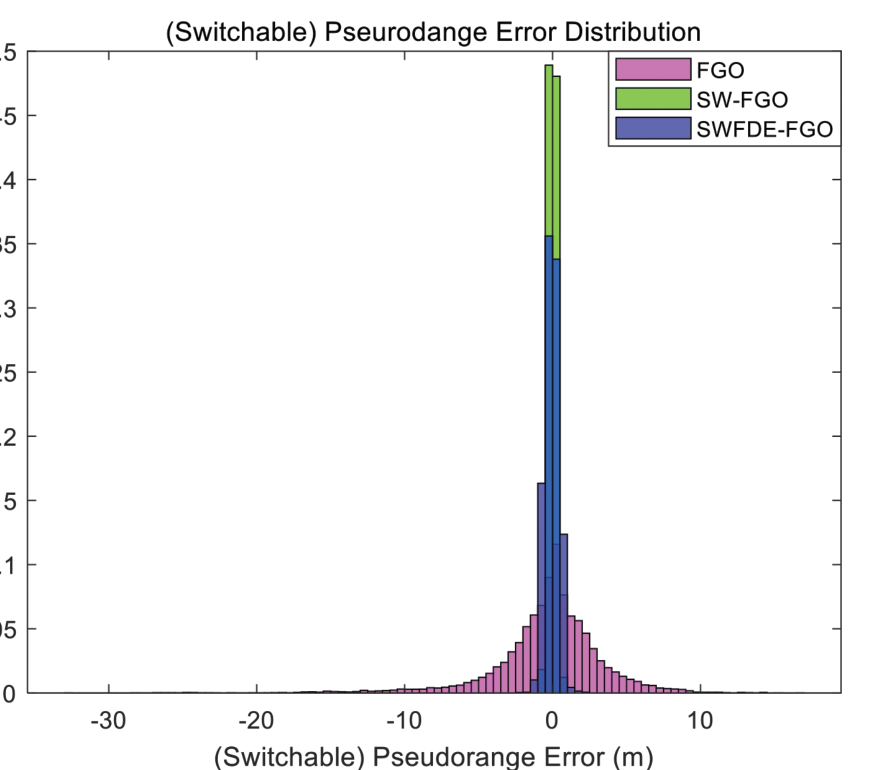
The pseudorange-error distribution explains how switch values narrow or reshape residuals while retaining geometric information.